
This blog captures an intuitive understanding of concepts such as Regression analysis required for deeplearning.
The following are summary of my notes from week 1 of the Udacity Deep Learning course.
Linear regression
is used to model the relationship between a dependent variable and an independent variable. The intent is to draw a line through your data that best fits your data. This line is then used to predict a value when a new point lands in. Linear regression only works for data that is linear and is sensitive to outliers.
Example: I could model life expectancy of an individual based on BMI of the individual if I had built out a model of BMI —> Life Expectancy
Multiple linear regressions
While linear regression modelled a relationship between 1 independent variable and 1 dependent variable, multiple linear regression factors in other independent variables as well.
Example: The previous example is highly simplistic in assuming that we can predict life expectancy of an individual based on BMI only. However, if we do add heart rate data as an independent variable, we are likely to classify the data much more accurately.
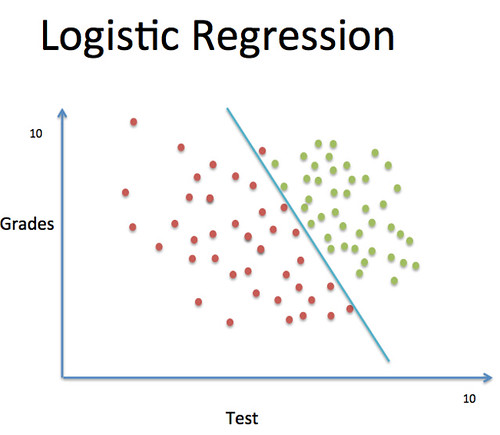
Logistic Regression
is a regression model where the dependent variable can only have two output values “pass/fail”, “alive/dead”. I am going to use an example from the Udacity course.
Example:
A college admissions office looks at the grades and test results of an individual to accept or reject the person in the university. In the sample picture attached to the blog, every one who is green has been accepted to the university in the past while everyone on the red has been rejected.
This data splits very cleanly and doesn’t really require a neural network to predict acceptance/rejection of a new student. We will make this more complex as we go to the next example.